Basics of Market Profile Technical Analysis
Market Profile
Market Profile is a way of organizing data. It organizes data in such a way that it reveals various AMT principles in real time.
In a MP chart the regular bars and candlesticks are replaced by letters (one letter for each 30 min bar is the most common setting). These letters are then collapsed on to the price axis to give it a distinct shape, which sometimes resembles a bell curve.
Auction Market Theory
Auction Market Theory explains how buyers and sellers interact in a market to determine the price of an asset. It works just like a real-life auction, where prices move based on demand and supply:
If Buyers Are Strong: Prices go up as buyers compete to purchase the asset.
If Sellers Are Strong: Prices go down as sellers compete to attract buyers.
Balance Is Found: Over time, the market finds a “fair price” where most trading happens, known as the point of control (POC) in Market Profile.
This theory helps traders understand how the market moves and where the most activity occurs, making it easier to spot patterns, trends, and trading opportunities.
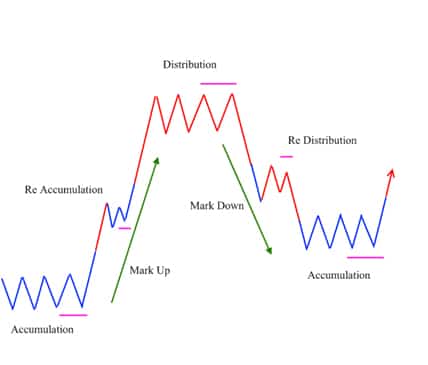
Market Cycle
It is the cycle in which the markets move up and down through various stages such as Accumulation – Mark Up – Distribution – Mark Down and sometimes the intervening stages of Re-accumulation and Re-distribution.
AMT
Auction Market Theory proposes that all financial markets work like an auction. That the price will move higher in search of sellers and price will move down in search of buyers.
Once the price has move low enough to uncover buying strong enough to stop the down auction, a new auction up will begin.
Market Profile Charts can be used effectively along with AMT principles to trade low risk opportunities in financial markets.
Normal
When price stays within the initial balance the whole day the day type is called as a Normal Day.
Balanced Profile
Wider Initial Balance
maximum participation happens at the center of the profile
Directional IB Breakout
OTF Shows their presence
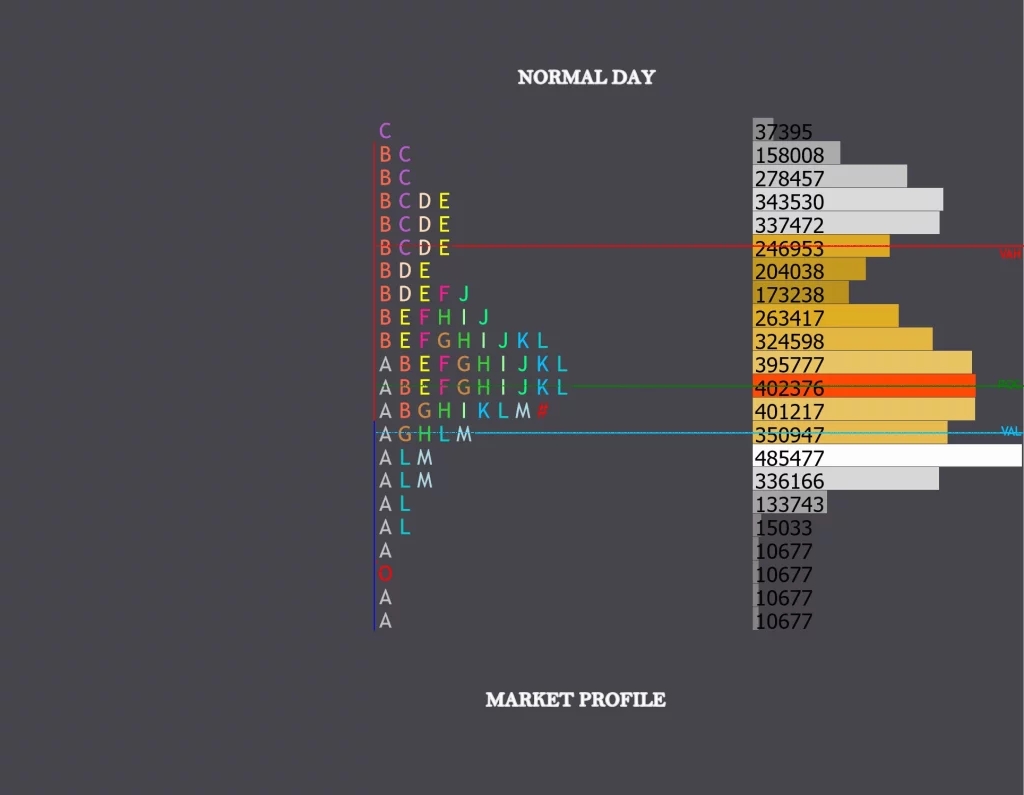
Normal Day
Swift early entry of OTF
Then OTF buyer/seller auction price within wide IB
Caused by overnight or early News Announcements.
Normal Variation
When price moved outside of initial balance in subsequent periods, but does not create a range greater than twice the initial balance the day is called a Normal Variation Day.
Typically an imbalanced profile
The range extension is more than 2 times the Initial Balance
Higher timeframe in control
Initial Balance is typically smaller than the normal day
But higher than the trend day.
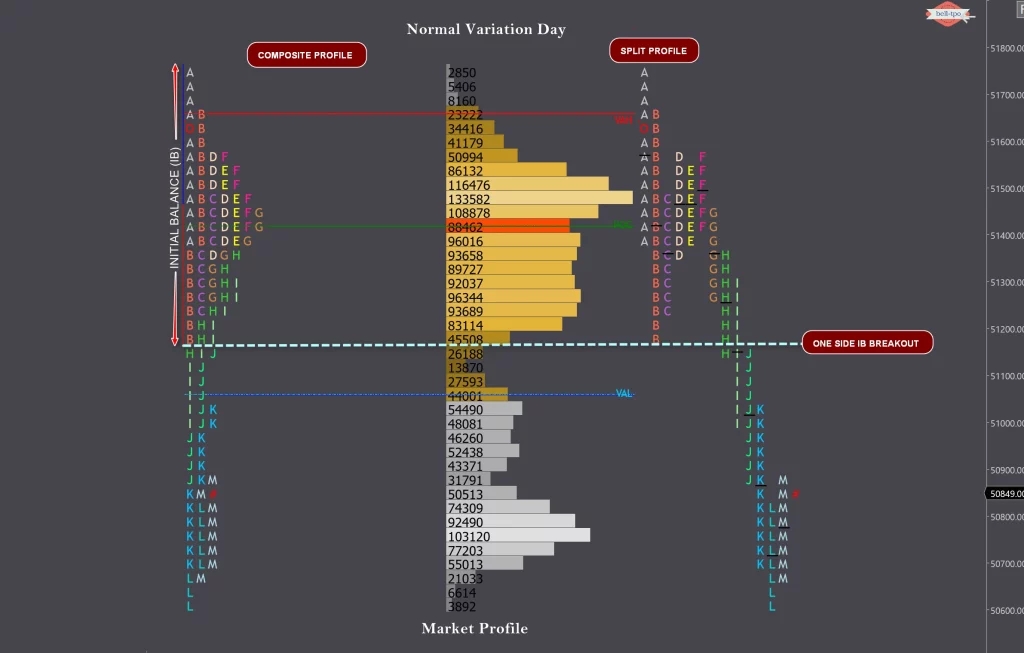
Normal Variation Day
Early activity not as dynamic as Normal day.
Later OTF enters and extends the range substantially.
Range extension points to presence of OTF participant.
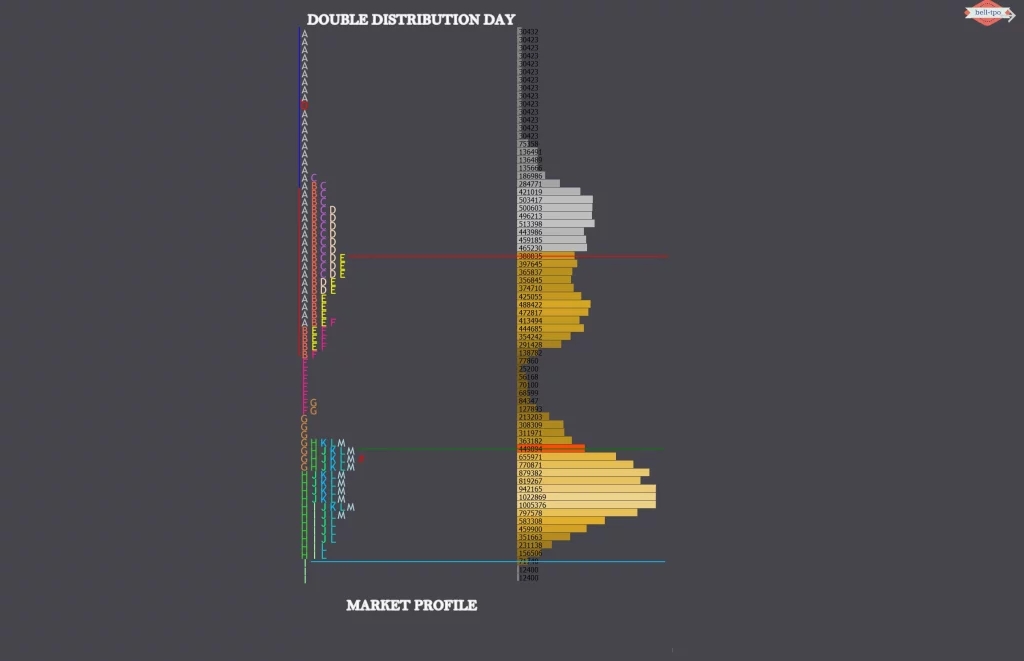
Double Distribution Trend Day
When price forms a narrow balance to begin with and then BO/BD from that balance and then form a second balance in the same day, the day type is called a double distribution trend day.
Distribution is an imbalance profile where Initial Balance
Two Balance Regions created separated by Single Prints
Higher timeframe in Control
Smaller IB range
Those Single Prints indicates the presence of higher timeframes
Neutral
When price extends range beyond the IB in both directions and closes within the value area, it is called a Neutral Day.
Neutral Day is a balanced profile where initial range is smaller than Normal day.
Both the Other timeframe buyers and other timeframe sellers are Present
Range Extension happens on both the sides
Price closes around the center of balance
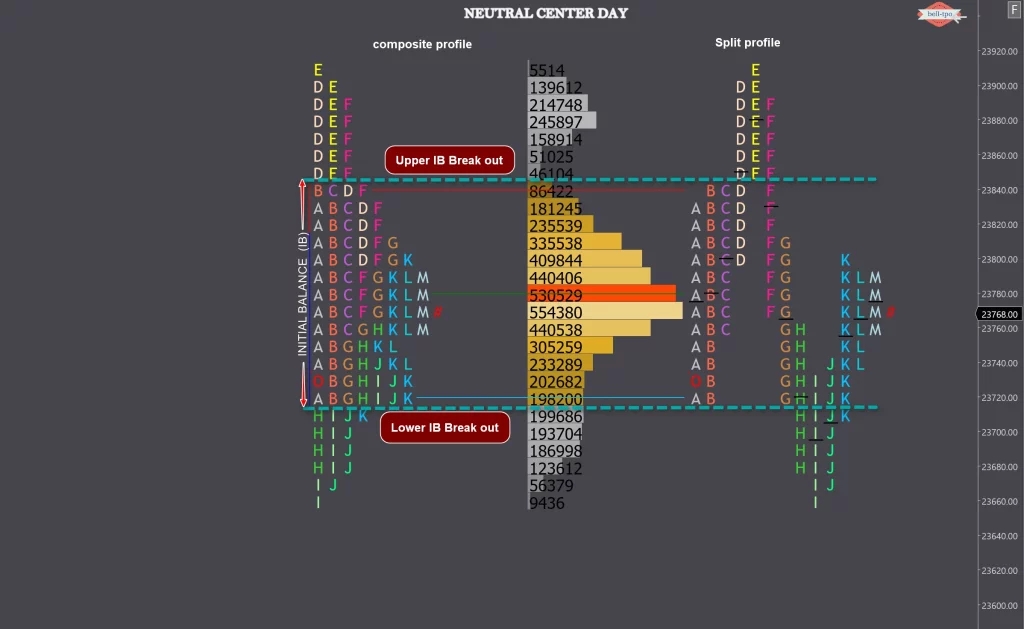
Neutral Center Day
OTF buyer and sellers have a close view of value.
Both OTF buyer and seller are present, evidenced by range extensions on both sides.
Price closes in center of the profile after trading at both extremes, indicates between OTF buyers and sellers.
NEX
When price extends the range in one direction and then moves in opposite direction and extending the range at the other end, as well as closing on the extreme, is called a Neutral Extreme day.
The days developments are similar to Neutral Center Day.
Only the close is at one of the extremes.
This indicates a hypothetical victory for on of the participants.
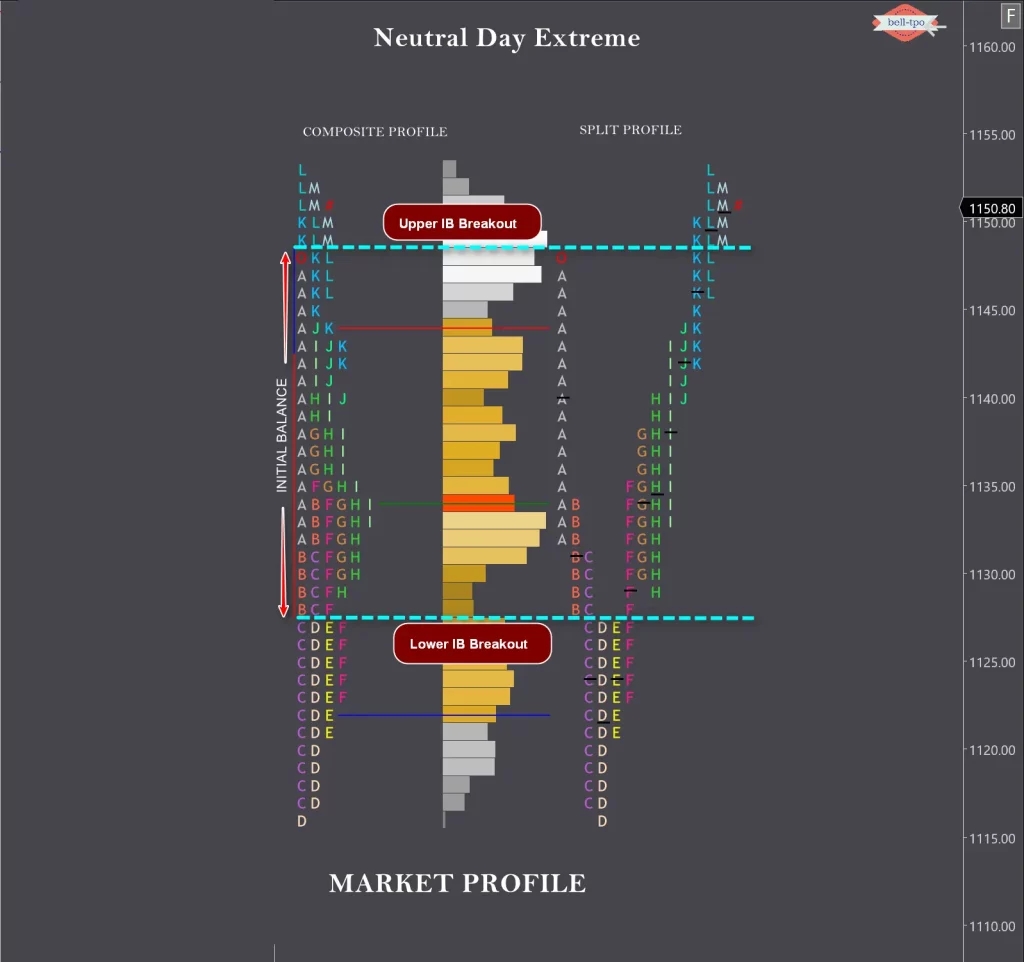
Neutral Day Extreme
Neutral Day is a balanced profile where initial range is smaller than Normal day.
Low volume in the first half. Lack of Higher timeframe in the first half.
Second half will be exciting as volume starts flowing and price breaks both the IB low and IB high with strong volumes. Shows the dominance of higher timeframes stepping in.
Price closes on one of the days extreme
Open Types
OIR
When prices open inside yesterday’s range, we call it Open Inside Range.
The range development potential is limited.
OOR
When prices open outside yesterday’s range, we call it Open Outside Range.
In this scenario the range development tends to be wide, and dynamic moves can be expected.
Open Drive(OD)
Open Drive exhibit maximum confidence from the OTF timeframe traders
Opens Gap up and Never got back into the previous day range
Opens Gap up and Trades in the same direction of the previous day
Low made in the first 30 min never taken out throughout the day
Witnessed more in Bear market counter rally

OTD
Market opens and test beyond a known reference to check for any unfinished business, if not found we resume the drive. Second most confident opening.
Price Opens with Gap above/below Previous days range or Price Opens at the edge of the previous days range
Confidence exhibited by OTF timeframe traders is less than that of Open Drive
Opens Gap up and price got snaps back into the previous day range or value area in first 30min and once test is over Trades in the same direction of the previous day

Last updated